Dashboard: Difference between revisions
Jump to navigation
Jump to search
No edit summary |
|||
| (13 intermediate revisions by the same user not shown) | |||
| Line 3: | Line 3: | ||
A dashboard is a tool that presents all the relevant data and reports of your company in a visually appealing and easy-to-understand format. Additionally, it displays the current incidents that require attention and their corresponding action priorities. By using this dashboard, decision-makers can quickly access critical information, identify areas that require improvement, and prioritize their actions based on urgency and importance. | A dashboard is a tool that presents all the relevant data and reports of your company in a visually appealing and easy-to-understand format. Additionally, it displays the current incidents that require attention and their corresponding action priorities. By using this dashboard, decision-makers can quickly access critical information, identify areas that require improvement, and prioritize their actions based on urgency and importance. | ||
=Features and Functionalities= | |||
[[File:Dashboard.jpg|1000px|thumb]] | |||
= | ===Real-Time Incident Action Priority=== | ||
*Dynamic display of current incident action priorities (high, medium, low) for prompt resolution. | |||
===Action Management=== | |||
*Comprehensive view of actions, including total, completed, and overdue actions for effective tracking and accountability. | |||
===Incident Tracking and Analysis=== | |||
*A holistic overview of incidents with data on total, open, and closed incidents for identifying trends and preventive measures. | |||
===Training Report Management=== | |||
*Insights into total, completed, and pending training reports to ensure compliance and track employee training. | |||
===Visualizations and Analytics=== | |||
*Visual representations and advanced analytics for quick data interpretation and informed decision-making. | |||
===Customization Options=== | |||
*Tailor the dashboard to specific needs by selecting metrics and customizing the display. | |||
===Real-Time Updates=== | |||
*Continuous refresh for real-time monitoring of incident action priority, actions, incidents, and training reports. | |||
===User-Friendly Interface=== | |||
*Intuitive interface for easy navigation and accessibility to users at all levels. | |||
===Data Export and Reporting=== | |||
*Export data and generate comprehensive reports for analysis, compliance, and sharing. | |||
===Integration Capabilities=== | |||
*Seamless integration with other systems and databases for synchronized data and streamlined workflows. | |||
Latest revision as of 03:26, 28 May 2023
Overview of the Dashboard
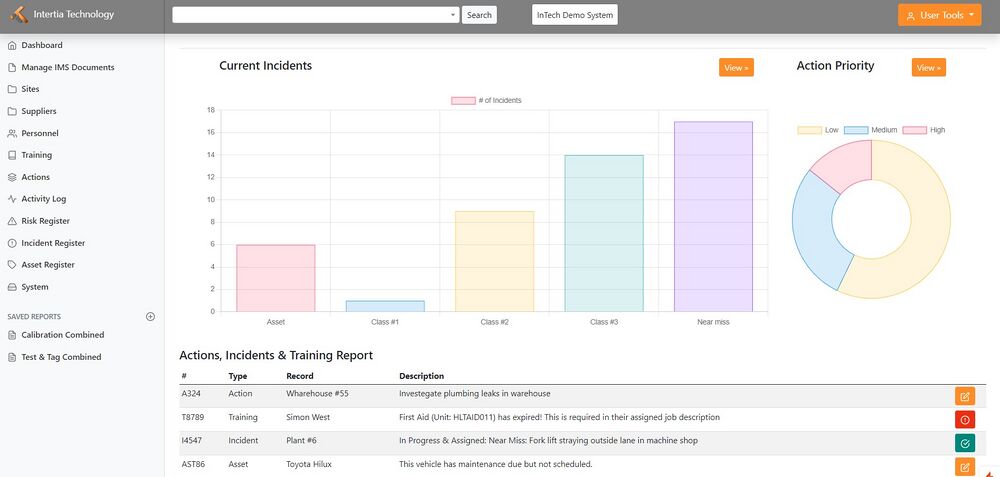
A dashboard is a tool that presents all the relevant data and reports of your company in a visually appealing and easy-to-understand format. Additionally, it displays the current incidents that require attention and their corresponding action priorities. By using this dashboard, decision-makers can quickly access critical information, identify areas that require improvement, and prioritize their actions based on urgency and importance.
Features and Functionalities
Real-Time Incident Action Priority
- Dynamic display of current incident action priorities (high, medium, low) for prompt resolution.
Action Management
- Comprehensive view of actions, including total, completed, and overdue actions for effective tracking and accountability.
Incident Tracking and Analysis
- A holistic overview of incidents with data on total, open, and closed incidents for identifying trends and preventive measures.
Training Report Management
- Insights into total, completed, and pending training reports to ensure compliance and track employee training.
Visualizations and Analytics
- Visual representations and advanced analytics for quick data interpretation and informed decision-making.
Customization Options
- Tailor the dashboard to specific needs by selecting metrics and customizing the display.
Real-Time Updates
- Continuous refresh for real-time monitoring of incident action priority, actions, incidents, and training reports.
User-Friendly Interface
- Intuitive interface for easy navigation and accessibility to users at all levels.
Data Export and Reporting
- Export data and generate comprehensive reports for analysis, compliance, and sharing.
Integration Capabilities
- Seamless integration with other systems and databases for synchronized data and streamlined workflows.
